Statistics from Thingiverse and popular models for 3D printing
I try to answer a few questions about the data from Thingiverse.com I showed in previous posts.

In the last few posts of 2022, I shared what I found within the data from Thingiverse.com, using Python. It was a fun Data Analysis exercise, and I shared all the code I used, if you are interested in that.
It's been a couple of weeks since, and I've realized that my previous two posts about this were too much of a mixture of Python scripts, interactive charts, and tables. Some people reached out to me commenting or asking about the content of one post and the results I got, while I actually treated the topic better in the other one.
The interesting bits were scattered and sometimes not clear if you were not into the whole "show-me-the-code-snippets" mood, but just wanted to know more about the insights.
So I thought, there's a ton of information out there about how to use Python to work with APIs, or analyze data with Pandas. But the facts I found from Thingiverse.com can surely be interesting for people in the 3D printing community, and I think they deserve a dedicated post for clarification.
So this one will be shorter, with no code, and will try to answer three questions I received.
Is the data from Thingiverse API reliable?
When I used Python to collect data from Thingiverse's API, one of the first things I wanted to check was whether the information from it was reliable. I checked the number of missing elements and compared some numbers with things I could see online.
For instance, the number of makes of the 3D Benchy on the site matched the data I collected on October 30th, 2022. I certainly had no way to verify whether the numbers are correct by myself, but I least I could see they agreed with the information shown on the site.
This was a somewhat unuseful check since the analytics shown on Thingiverse have been known to have issues, as experienced and discussed by many over forums and subreddits. There are even people creating apps to track the issues on the site and work around/mitigate what they can. Having experienced unrealistic analytics myself, I didn't know whether the rest of the information on the site was also corrupted.
Luckily, one of the developers working at Makerbot clarified that the number of likes on the site should be more reliable than the stats people are seeing on their analytics pages.
Of course, this is not a formal statement, but at least is an indication that we are using something more reliable - which is appreciated. They also anticipated that there's a dedicated team working now on the site, which is awesome news and could mean it'll become stable/reliable soon.
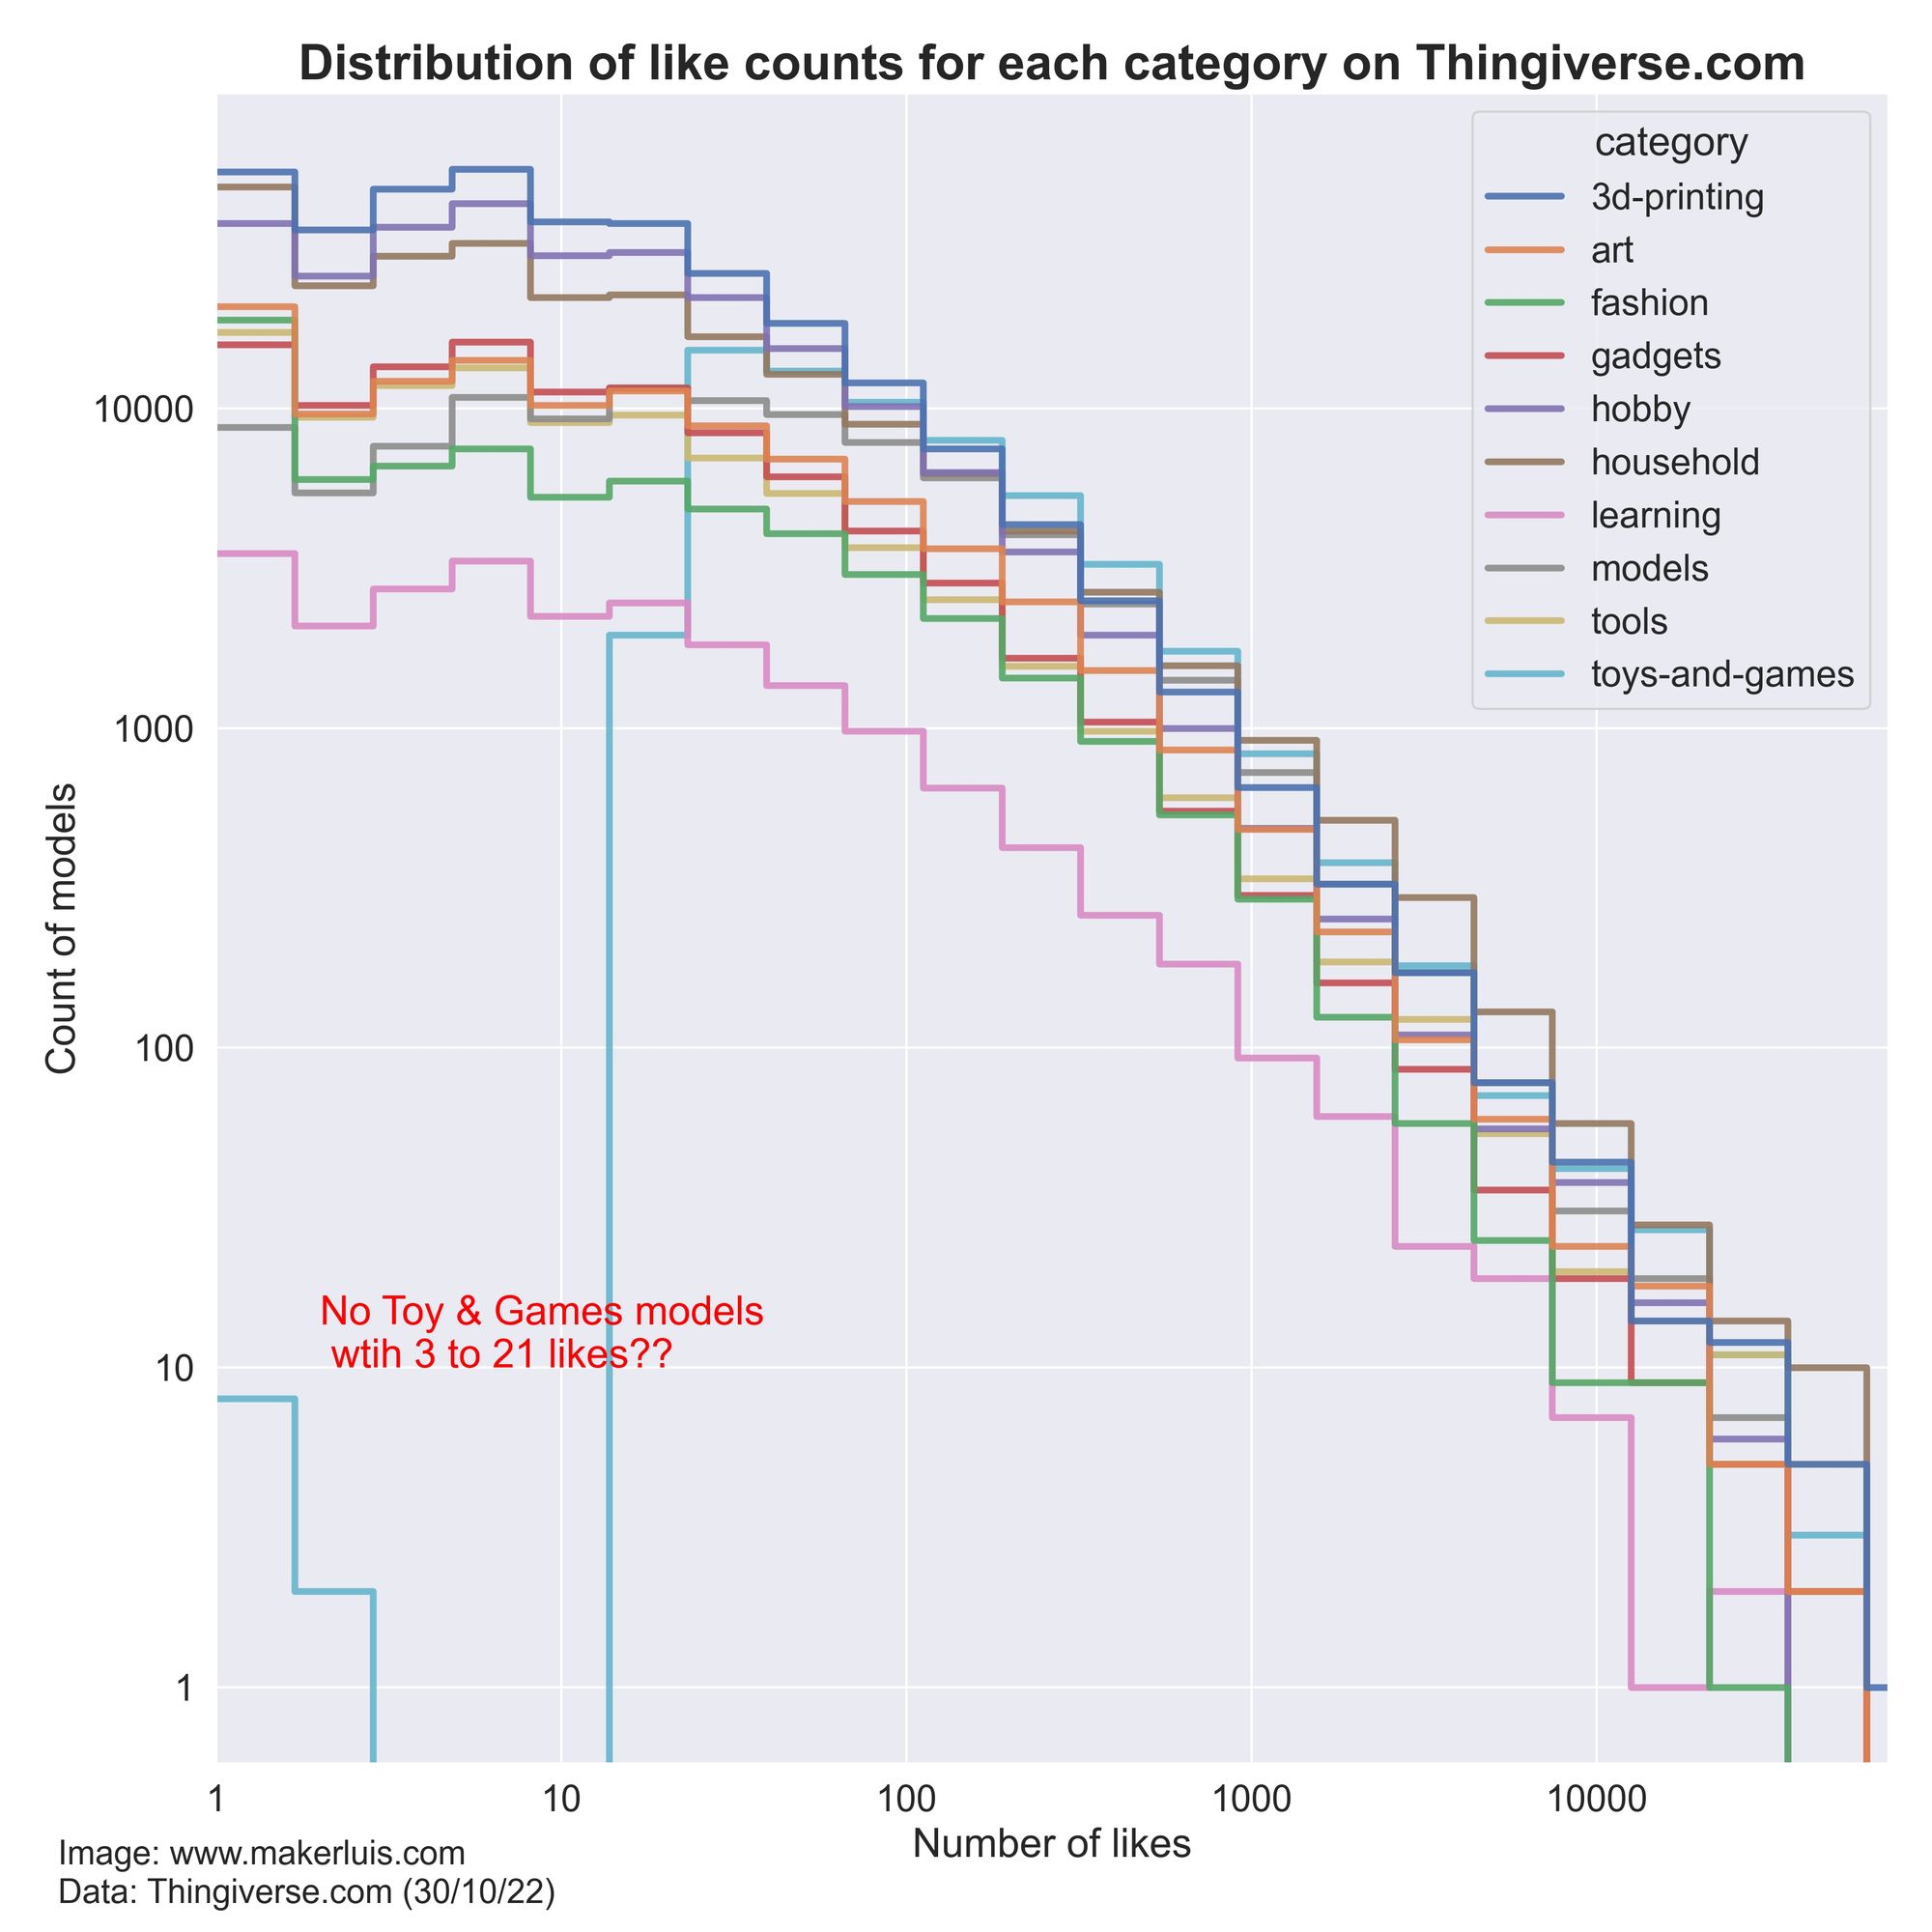
The only "glitch" I found in the data was the distribution of likes for the Toys-and-Games category. It is off. As you can see in the image below, based on the data from the API, there are absolutely no models with 3 to 21 likes for that category - while the others have the highest counts around those numbers. It could be an error from the python script I used or an issue with the site's API response.
Bearing those two things in mind, I think we can have a look at some interesting results about the usage of Thingiverse and the popularity of 3D print files.
Is Thingiverse.com really "dying" or being abandoned?
This is a common statement among people on Reddit and discussion forums about 3D printing. Sometimes I've also felt inclined towards that thought, but it is just a guess, and it's based only on sentiment, derived from personal opinions, and discussions in online forums.
Maybe this is in part fueled by all the hype around newer sites that provide very solid alternatives, like Thangs.com, CrealityCloud, and my personal favorite, Printables.com. They have shown to be actively developed and maintained, and have quickly gained popularity from some aggressive strategies, including collaborating with influencers, launching periodical contests, posting frequently on social media, and other.
Thingiverse, instead, seems to simply "be there", with no active marketing around - their latest Instagram post is from 2019. People wonder whether the site is being maintained at all, and there is this great discontent around the 3D printing community towards it, because of the many issues I talked about before. But, are people still using it to publish their 3D print files?
I wanted to have a more objective or at least quantitative answer for this.
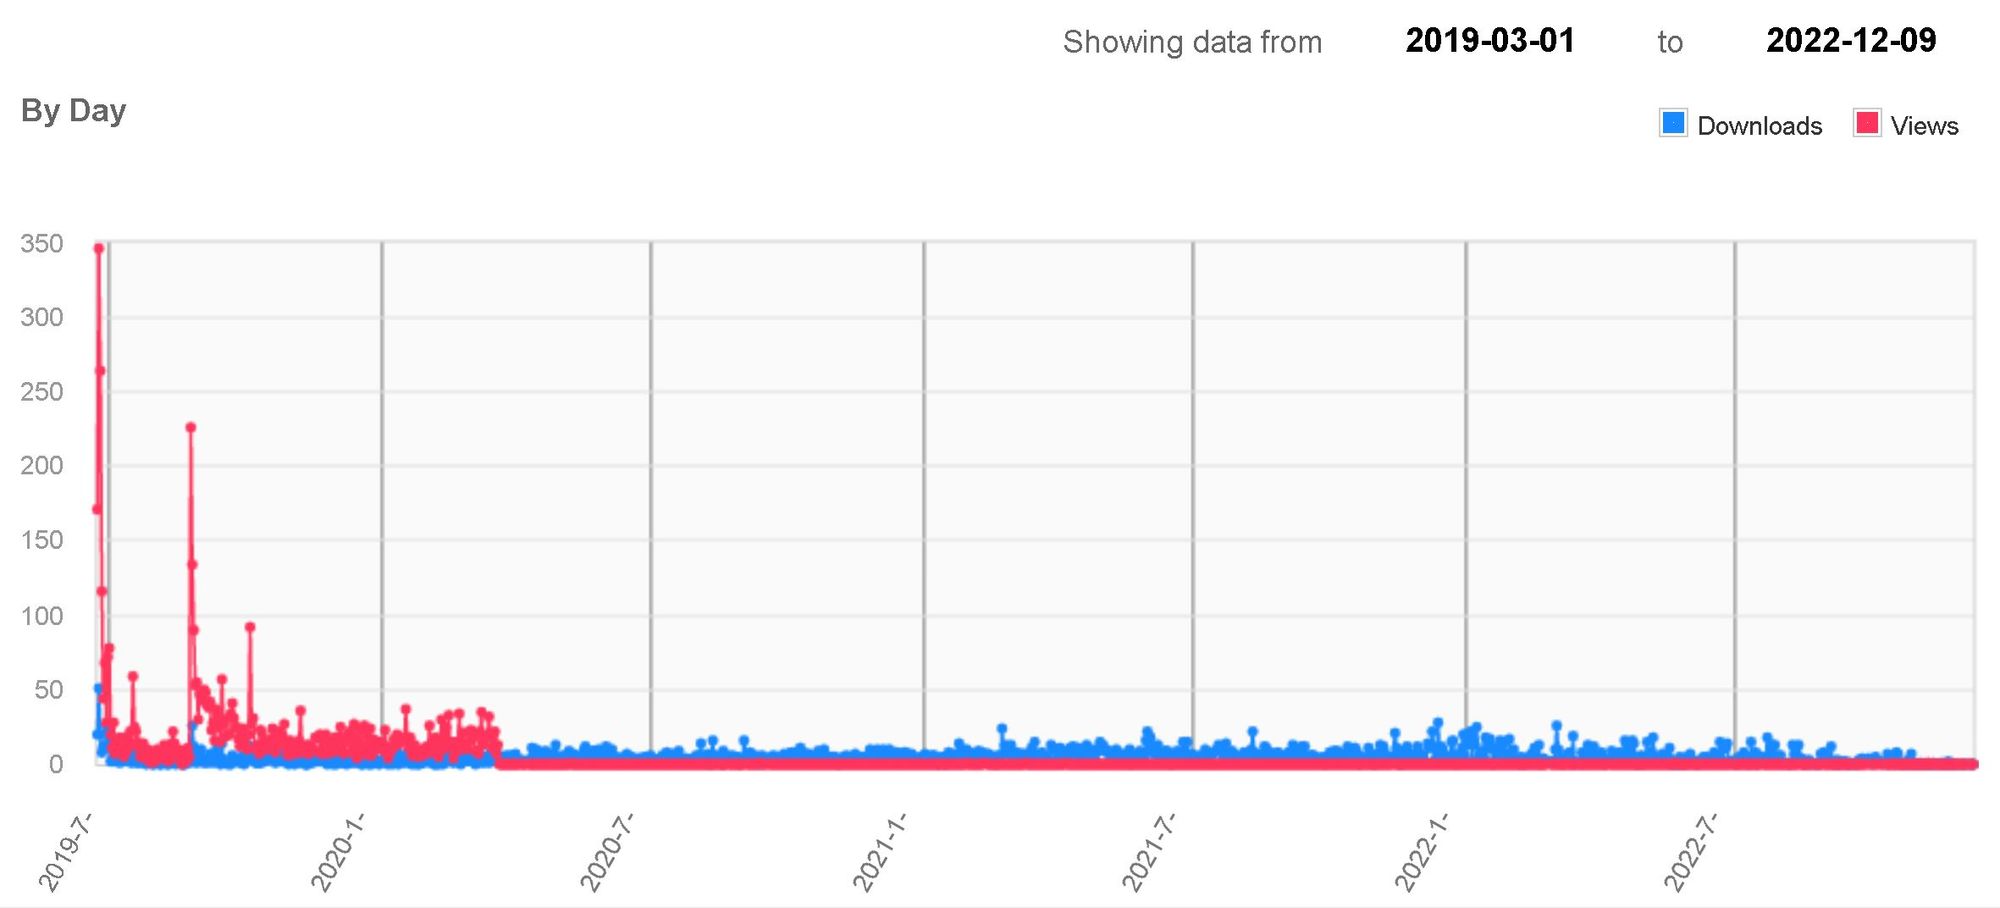
I've already shown the evolution of the number of monthly publications on the site over the years, with the spike around the 2020 period, when people had to spend more time at home, which probably drove the number of new published models on the site. That plot also allowed us to see that there is a seasonality in the number of new publications - higher numbers around wintertime for the northern hemisphere). What isn't really clear from the chart is: has the total number of models available on the site continued to increase at the same rate or has it slowed down? - which would mean that fewer models are being uploaded over time.
To visualize that, I plotted the accumulated number of models, since the oldest one available - from November 9th, 2008.
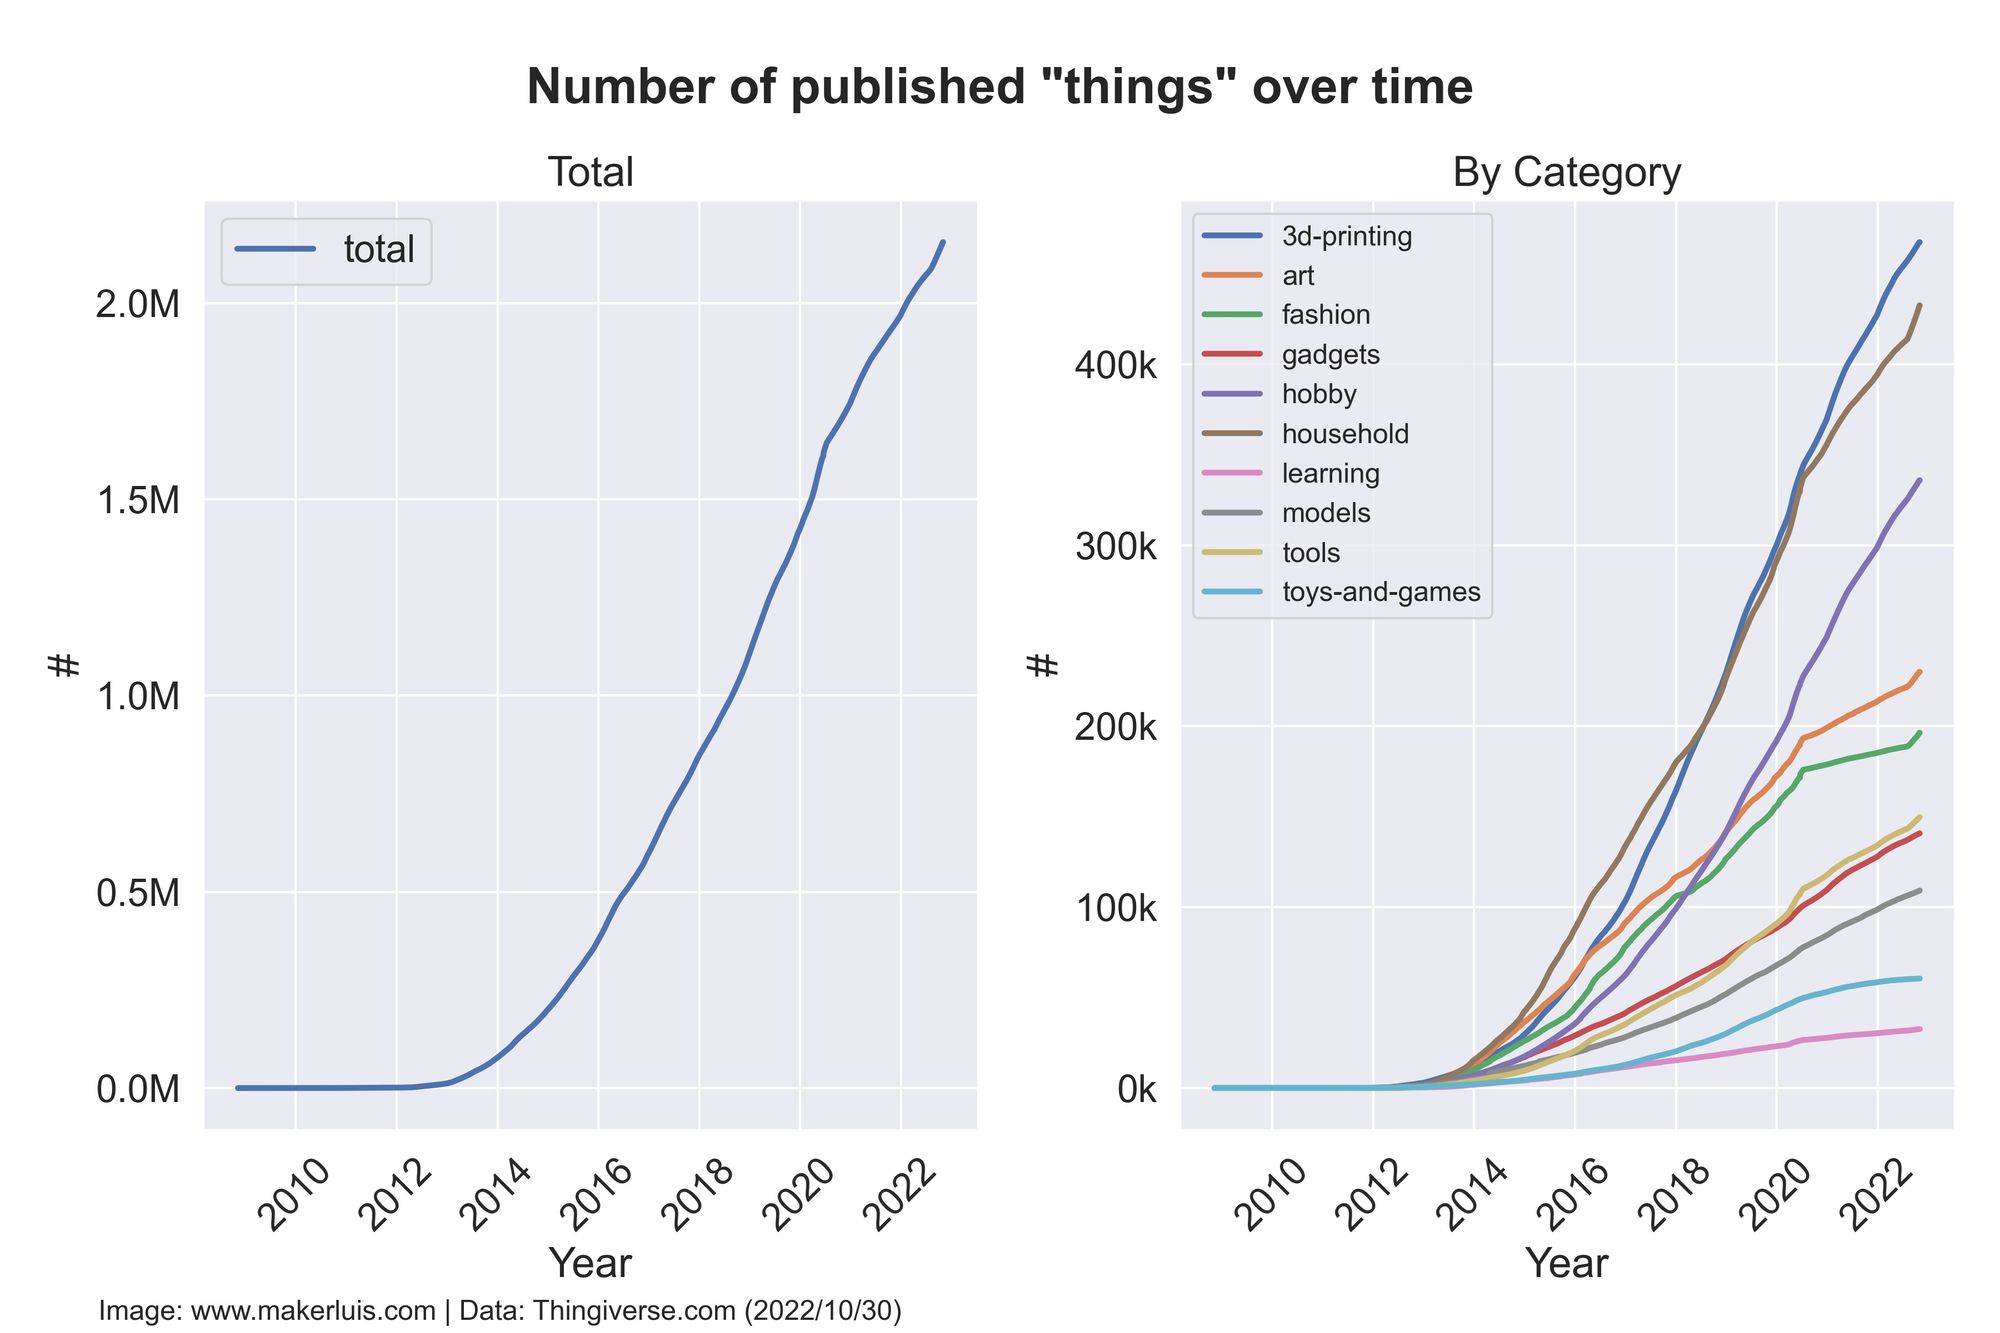
From the figure, I don't think there is a strong indicator that fewer users are uploading their 3D printable files on Thingiverse. From the left figure, we can see that the number of models classified as "hobby" has increased significantly faster than the other categories, while the increase of total "toys and games" models seems to be rather stalled.
Anyways, the overall trend seems to be monotonically increasing, so I think the answer to my question is: No, Thingiverse is not dying.
To visualize the figure on the right differently - and, basically, for fun - I created a bar chart race animation using Flourish.
Most models uploaded to the site are classified either as 3D printing-related files (printer upgrades, replacement parts, calibration tests, torture tests, etc...) or household/home improvement items. To me, this could mean that most site users are likely to be owners of consumer/hobby-grade 3D printers (people who tinker with their printers, doing upgrades and looking for replacement parts, or testing the quality of their prints) or people who use 3D printers to create objects to improve their homes.
Is it normal to receive only a few likes for a model uploaded to the site?
I think the site is dead because I am not getting any likes and the 3D model I uploaded should be more popular.
People asked me whether there is a metric that can be used to determine whether a model is below or above the average popularity of 3D print models. This is quite difficult to determine, especially considering that I only have access to data from one site, with no information about the downloads, but I'll try to answer it.
First, I need to define what "popular" is. Each site has its own way to determine what popularity is, based on user engagement and site traffic. On Thingiverse, you can filter search results by "Popular", for instance.
But of course, if you take your newly uploaded model and check its stats against the ones on the front page of the search results, which have probably become viral online, it's really hard to make a proper comparison.
For simplicity, I would say "popular" means whether many people like the model. But again, "many" is relative.
The average number of likes of all models published on the site is 35. But the distribution is left-skewed, as you can see in one of the figures at the beginning of this post. Because of that, a more relevant indicator of the center of the distribution is the median number of likes for all models, which is 2. This means that the vast majority of models get around 2 likes, regardless of when they were published or which category they belong to.
To put this in perspective, more than 80% of the models for all categories have less than 100 likes (by October 30th, 2022).
Of course, those numbers change when considering different categories. For instance, the most popular one seems to be "Toys and Games", with an average of 182 likes per model, while the least popular is "Fashion", with 17. I've discussed the distribution among the different categories in a previous post.
But popularity could also be indicated by how fast that number of likes increases. Or put in other words, how many likes per day a model receives from the day it is published? Here come into play so many factors, including exposure of the model within the site itself, and also from outside sources.
Bearing that in mind, and as I showed before using cumulative density plots, more than 90% of the models of all categories have an average of less than 0.1 like per day - that is 1 like every 10 days. The average is actually around 3 likes every 100 days!
This means: if you published a model on Thingiverse and are getting at least one like every week, consider it quite popular! Statistically speaking, at least.
What about the models on the front page of search results sorted by popularity? They are surely getting much higher numbers, and that is because they are being shared on different platforms and social media. There is a huge difference between a model being silently uploaded, and one that is actually "shared" in a broader sense.
TL; DR
No, Thingiverse.com is not really dying, and yes, the data does have some flaws to be aware of, but in general, should be quite reliable about the number of likes for most categories. If you want to start a business around the 3D print models you create, you can't just hope that they become popular online so people are willing to pay for them.
Thank you for reading!