Replacing MATLAB with Python - Part 1
Stick with me in this series of posts if you want to see some examples of using Python for MATLAB users. I am not an expert, and the code I will share can probably be improved, but I think these practical examples can be useful for a beginner like me.


I work a full-time job as an automotive Control Systems Engineer, and - usually - a big chunk of my time during the day is employed using MATLAB/Simulink for different types of tasks.
I recently spent a couple of weeks without an individual MATLAB license at work. Of course, I had the chance to use workstations with shared licenses in the office to continue working in Model-Based software development. For that kind of activity, you can't just go around the license problem.
However, I took the chance to sharpen my Python skills while completing some of the other tasks I had to do, mainly when analyzing data.
I figured that I could share some of the things I learned, and started to write an article that suddenly was too long for a single post. So this will be an ongoing series of posts.
In each entry, I will share a simple but practical example of how to do a certain task with MATLAB, but using Python instead. Probably some of the code can be improved, but I think it can be useful to see these examples if you are a beginner like me.
Why Python?
I could have used other alternatives, like GNU Octave - which even has the same MATLAB syntax, or Scilab. But I wanted to learn more about Python, since it is a general-purpose programming language.
I think this is important since Python opens the possibilities for individuals and companies that cannot afford to buy an expensive MATLAB license, or are already using MATLAB for scientific computing, in which case it can be easily replaced with Python, cutting down the license costs.
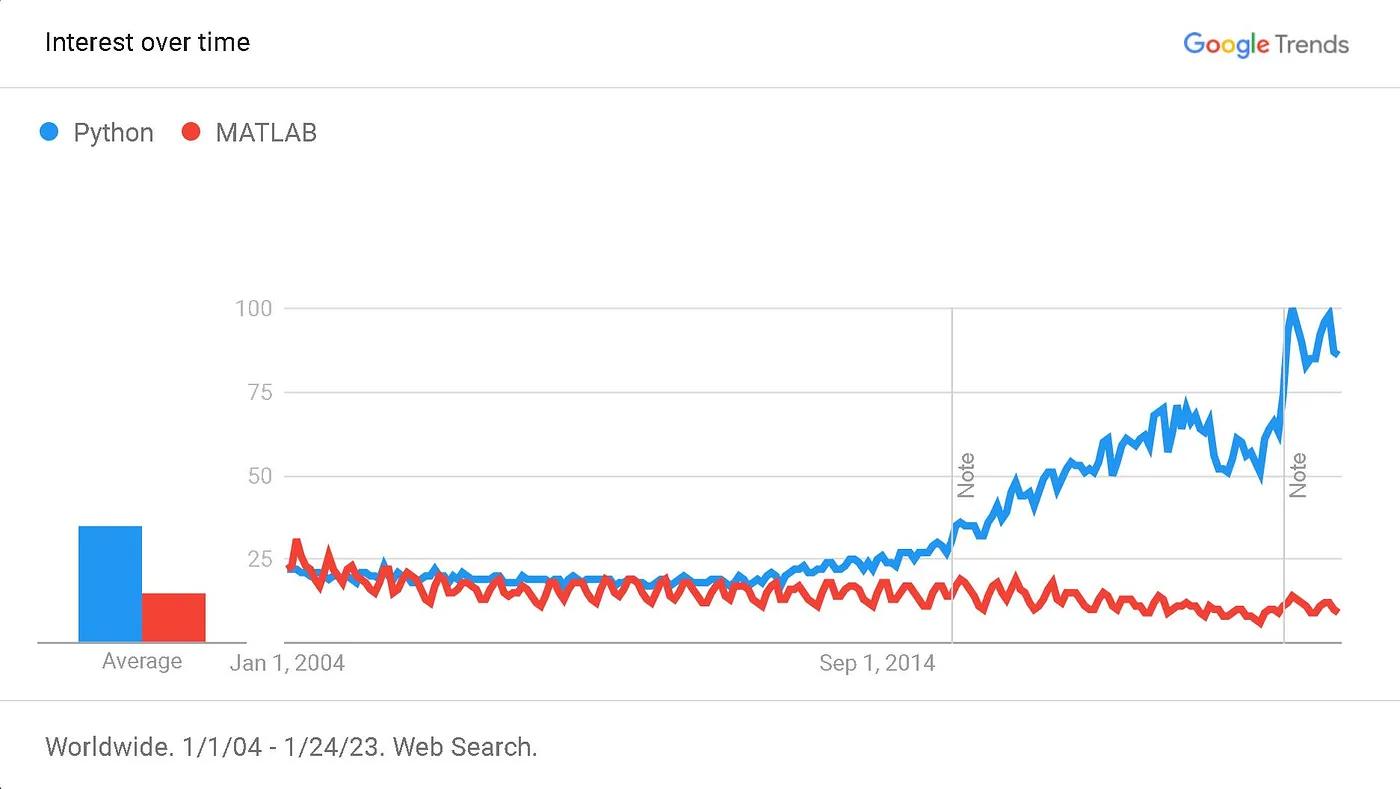
MATLAB is still being used widely, especially in the Automotive and Aerospace industries, but the usage of Python has grown dramatically in many different sectors, since it can be used for many other things - like I said, general-purpose.
Python cannot really be compared with MATLAB, as they were designed for different purposes, but I will focus on the use cases that can overlap between the two of them.
About Automotive file formats and data extraction
Skip this part if you are not interested in automotive-specific data.
Extracting and doing the first-level analysis of data from large log files is a very common use case of MATLAB in automotive testing environments - at least from what I've seen in three different large companies in Europe. It could be seen as a mundane activity, but it is not straightforward if the files you have are in different formats. Also, it might be something you need to do very frequently.
For this series of posts, I will look at the tasks I learned to do with Python once the data was available in some kind of universal text encoding. For instance a CSV file or an ASCII file. This is not always obvious, and there were many cases in which I needed to convert VECTOR CAN log files or other ASAM standard formats to text, or use some kind of API to be able to work with them in Python or MATLAB. But that will be part of another article later on.
How to start using Python?
First of all: this will not be a Python course. I am assuming you have already some basic understanding and want to see some basic examples of how to use it. You can learn the basics very quickly with tons of free tutorials and courses out there.
I followed the Scientific Computing with Python Certification on FreeCodeCamp.org a while ago, and it was great to grab the basics. There are also great resources like Real Python and Geeks for Geeks, and many courses on Udemy, Coursera, EdX, DataCamp, and others.
If you are coming from MATLAB and want to start using Python, you probably want some kind of user interface or IDE (Integrated Development Environment) to work with. There is no unique or best answer here, so I will just tell you about the ones I have tried.
The first thing is, of course, to download and install Python 3 itself (Python 2 is already in an End-of-Life stage and will no longer be supported by new libraries). Then, you can download and install one of the following IDEs:
- Jupyter Labs. Probably the most used interface for working with Python nowadays. It allows you to work on your web browser, and the Jupyter Notebooks allow splitting the code into cells that can be run individually, as we do with MATLAB's code sections.
- SPyder IDE. In my opinion, this one provides the closest experience to MATLAB in terms of interface. You can even have a panel to look at the variables you are working with, for example, and interactive plots. You can install add-ins to work with Jupyter Notebooks within the Spyder IDE too.
- Visual Studio Code (VS Code) This is a more general-purpose programming IDE, but has great support for Python, including support for Jupyter Notebooks too.
Personally, I prefer to use VS Code since it allows me to work also on other types of programming projects in the same environment, for example when working with Arduino. However, the code examples I will share will work no matter the IDE you are using.
Ok! Enough with the introduction, let's jump to the first and most simple example of this series.
Example 1: Simple time series visualization
Normally, working with MATLAB or not, the first thing to do after loading data from some large file would be to plot a time series of the most interesting data (or signals, if we are talking about a CAN data log file, for example). This way I can at least know what I’m dealing with. For this example, I will use this example file, which contains some CAN data from a Formula Student Electric car.

If you download the file, you'll notice that there are missing values on each variable (CAN signal). The good news is that there is a common time vector for the different channels - although the data might have been transferred at different rates over CAN.
To look at this file with MATLAB, I would do something like this:
Notice that I extracted the indices of the non-empty values of each signal, and then used that to represent the data. I also did some formatting to the plot to make it understandable.
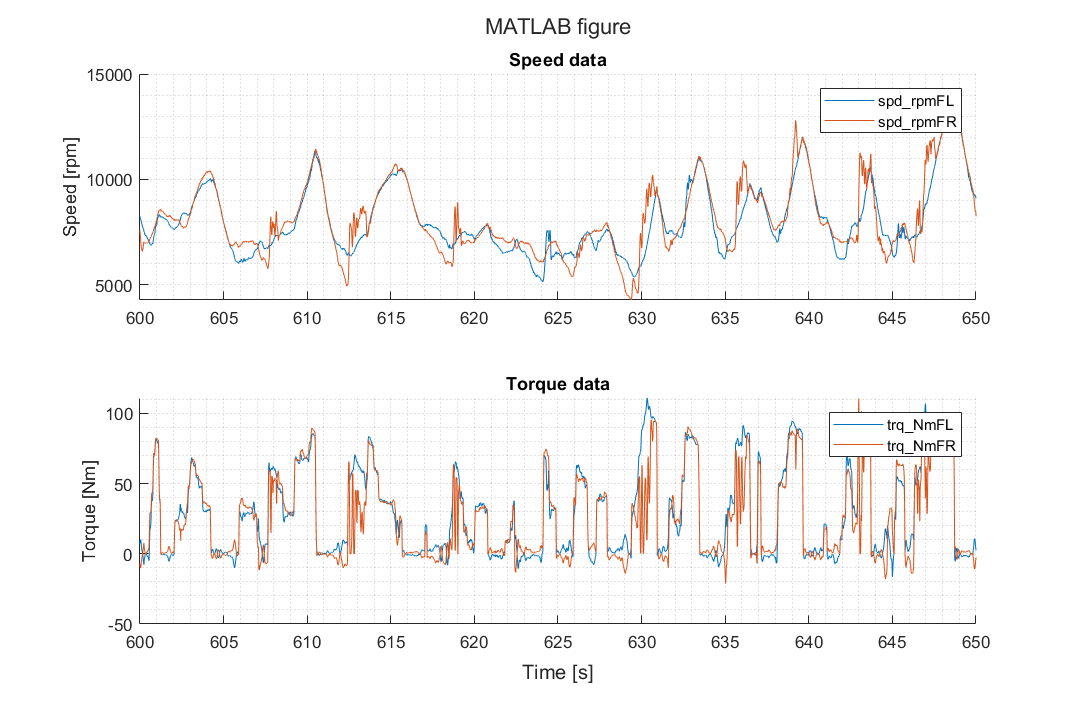
I needed to represent data containing information about speed, in rpm, and torque, in Nm. And I wanted to visualize both against the same time scale, in order to understand what happened during the test I am looking at.
This is why I created a tiled layout. I could have used subplots instead, and the results would have been very similar. Or I could have plotted both speeds and rpm against a single abscissa, but using two different y axes using yyaxis right.
The output will be something like this:
Simple enough, right? Let's see what we have to do instead when using Python.
The first difference you'll notice is that we need to import the Python libraries we'll use at the start of the code.
In this case, we are dealing with data from a text file, so it is a common practice to use the library called Pandas. It can be slow for doing complex computations or handling large datasets, but there are some workarounds.
In general, it is better to do the calculations using another library, Numpy. We simply import those using the import command before using anything from them.
Then we can read the file, and load the data as a Pandas dataframe.
In Python, we have to get used to working with methods other than functions. This will allow us to do different things with the variables we are working with, depending on what type of object (class) they are.
For instance, we loaded the data from the file as a dataframe object that we called df (we could have called it anything if we wanted, but df is more self-explanatory and common practice). Then, to extract the non-empty values we use the . notation to access the notnull() method of the dataframe class.
This is different from the function-based approach that I used in the MATLAB script above, where I used the isnan function, and it would have worked on either a double array, a scalar, a matrix or a multidimensional array.
However, methods and classes are not unique to Python, they exist in almost any programming language, and even in MATLAB. The difference is how they are used depending on the intent of the language.
MATLAB is specific for matrix computations, so it relies heavily on functions, whereas Python has specific libraries for different purposes, and they use both functions and methods to accomplish some tasks. There are also some built-in functions in Python
Next, we create the figure and plot the data. We first need to specify the figure size, otherwise, the default figure dimensions will be too small. In this case, we are using subplots to obtain the following result:
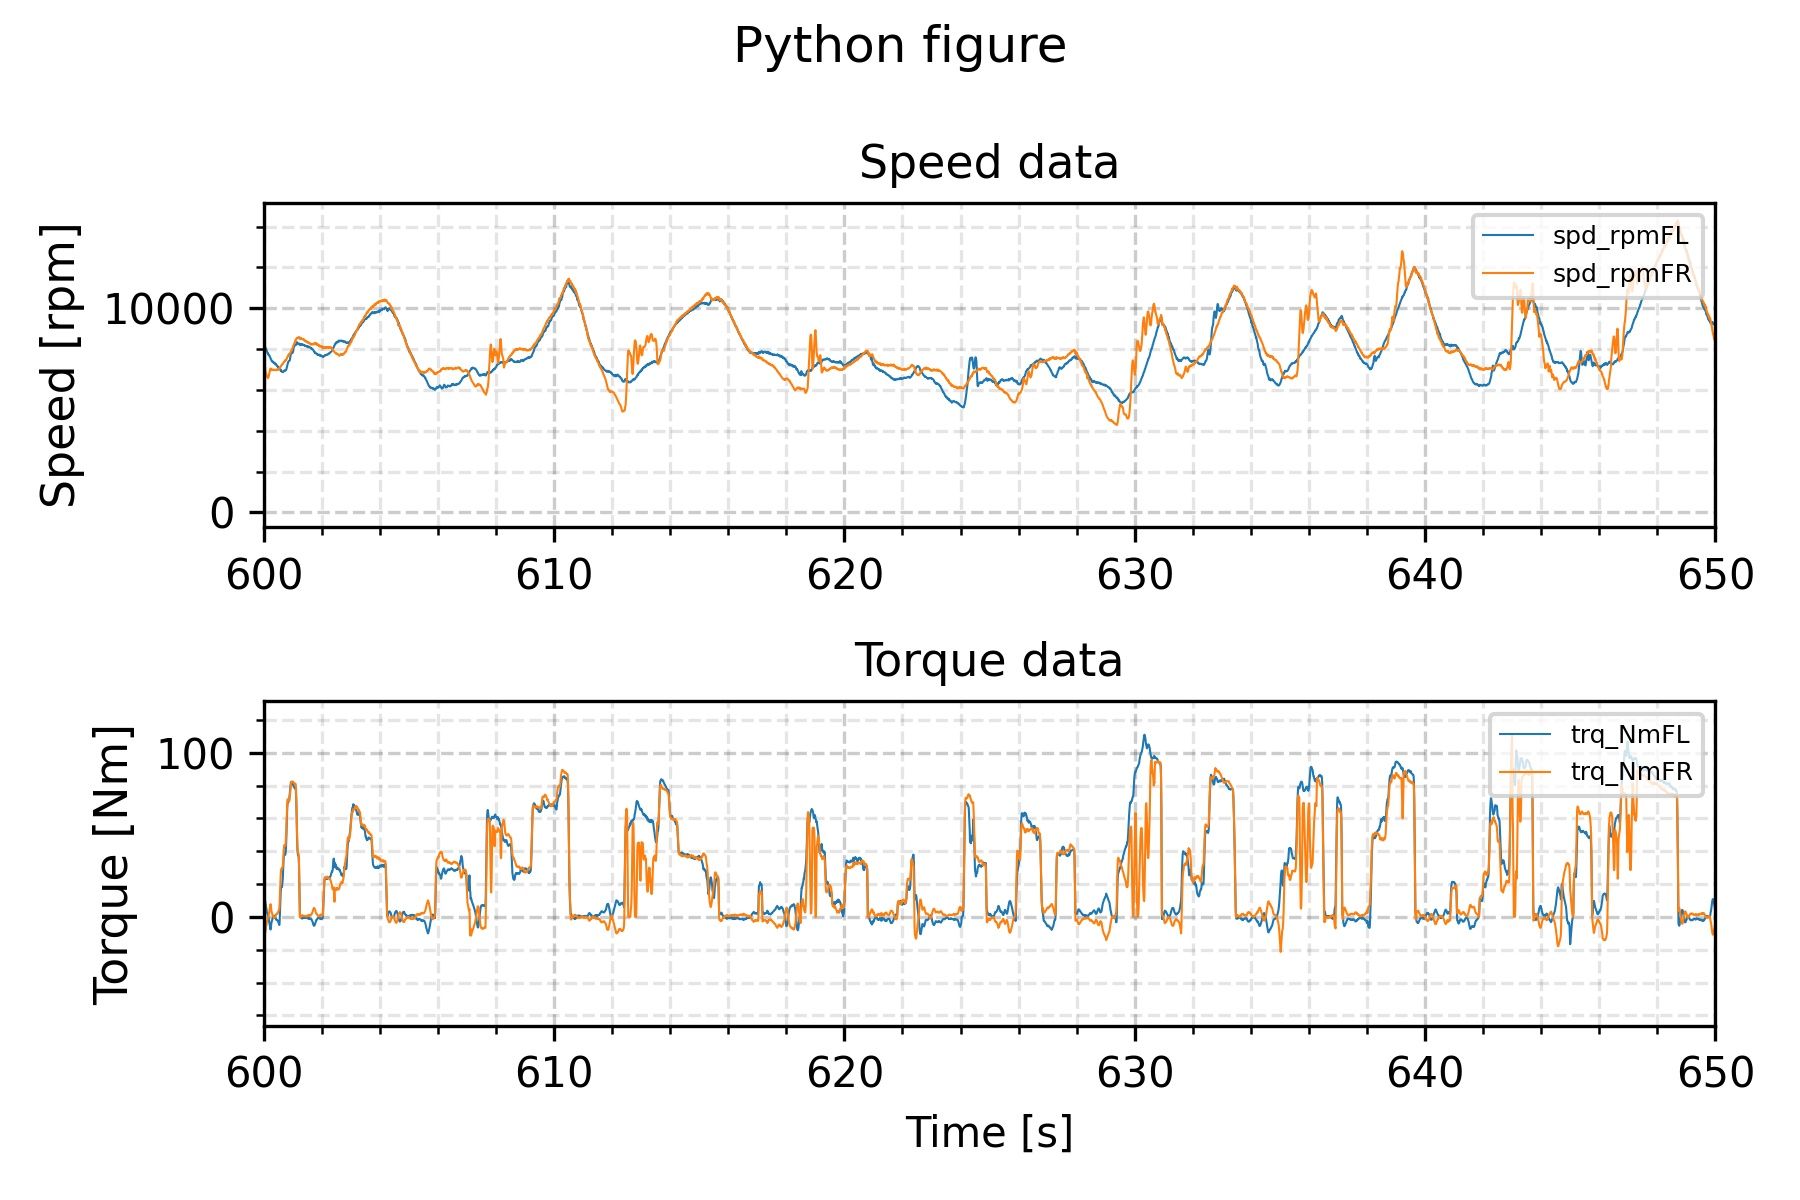
Granted, the Python plot needs a bit more manual formatting to have the same look as the MATLAB one. But this is not really an issue once you know what you need to change to get the format you want. You can set the defaults for creating figures on the top of your script, or make a function that does the formatting for new figures.
If you have trouble getting some details to work, you can just google your answer. The amount of Python users is huge and growing, so it is very likely you will find someone already asked a similar question online.
For instance, I was having a hard time getting the axes titles to show correctly, and there was a Stackoverflow thread solving exactly the same issue - turns out you need to add plt.tight_layout() for the figure to be padded correctly. Just part of the learning curve.
It's like when I needed to call the legend in MATLAB as legend('interpreter', 'none') to avoid tex interpretation of variable names with underscores, for instance.
Plus, this example was done using the "vanilla" Pyplot. There are other libraries for plotting, which can produce cleaner plots in different cases, depending on your purposes.
This post was a bit longer than the others, being the introduction of the series, but I hope you found it helpful or at least interesting. Over the next weeks, I will be sharing other example codes, highlighting the differences between MATLAB and Python, and showing also the things I struggled with. I hope you are motivated to learn Python, as I am, and this can be an incentive to try it on your own.
I will update this first post to index the new examples I include as I go, so it is easier to navigate between the different entries.
Until the next one!
Luis
Edit 2022-09-26: A list of the latest posts in the series:

I completed an example task using MATLAB. In the following posts I showed how to do the same with Python